Market Outlook
November 24, 2017
Market Cues
Domestic Indices
Chg (%)
(Pts)
(Close)
Indian markets are likely to open flat tracking global indices and SGX Nifty.
BSE Sensex
0.1
27
33,588
Nifty
0.1
6
10,349
U.S. stock markets were closed for their Thanksgiving holiday.
Mid Cap
0.3
51
16,836
European stocks were broadly higher in the mid-market trading Thursday amid
Small Cap
0.5
90
17,944
positive economic data in the region, despite negative sentiments following
Bankex
0.0
1
29,190
weakness in Chinese markets.
Indian markets indices ended higher on Thursday, extending their gains for the sixth
Global Indices
Chg (%)
(Pts)
(Close)
straight session, as investors continued to pick up key stocks on hopes that economic
Dow Jones
(0.3)
(65)
23,526
growth will pick up momentum, thanks to reforms initiatives
Nasdaq
0.1
5
6,867
FTSE
(0.2)
(11)
7,408
News Analysis
Nikkei
0.5
107
22,523
Biocon introduces oncologic biosimilar KRABEVA in India
Hang Seng
(1.0)
(296)
29,708
Detailed analysis on Pg2
Shanghai Com
(2.3)
(79)
3,352
Investor’s Ready Reckoner
Key Domestic & Global Indicators
Advances / Declines
BSE
NSE
Advances
1,431
805
Stock Watch: Latest investment recommendations on 150+ stocks
Refer Pg5 onwards
Declines
1,292
947
Unchanged
155
67
Top Picks
CMP
Target
Upside
Company
Sector
Rating
(`)
(`)
(%)
Volumes (` Cr)
Blue Star
Capital Goods
Buy
678
867
27.8
BSE
4,333
Dewan Housing Finance
Financials
Accumulate
619
712
15.1
NSE
29,650
Asian Granito
Other
Buy
488
570
16.7
Navkar Corporation
Other
Buy
190
265
39.6
KEI Industries
Capital Goods Accumulate
336
380
12.9
Net Inflows (` Cr)
Net
Mtd
Ytd
More Top Picks on Pg4
FII
289
14,403
52,855
MFs
2,326
3,825
99,236
Key Upcoming Events
Previous
Consensus
Date
Region
Event Description
Reading
Expectations
Top Gainers
Price (`)
Chg (%)
Nov27
US
New home sales
667.00
623.50
Nov28
US
GDP Qoq (Annualised)
3.00
3.20
Bajajelec
464
12.1
Nov29
US
Consumer Confidence
125.90
123.50
Renuka
18
8.1
Nov29
Euro Zone Euro-Zone Consumer Confidence
0.10
-
Indhotel
119
7.2
Nov30
US
Initial Jobless claims
239.00
-
Nilkamal
1,706
6.0
More Events on Pg7
Fortis
132
5.6
Top Losers
Price (`)
Chg (%)
Adanient
152
(3.4)
Deltacorp
253
(3.4)
Mfsl
565
(3.3)
Jpassociat
19
(3.1)
Unitech
6
(3.0)
As on November, 23 2017
Market Outlook
November 24, 2017
News Analysis
Biocon introduces oncologic biosimilar KRABEVA in India
Biotechnology major Biocon announced it has launched its cancer biosimilar drug
KRABEVA in India. The biosimilar product will be used for the treatment of patients
with metastatic colorectal cancer and other types of lung, kidney, cervical, ovarian
and brain cancers in India.
The company believes that the product will be an important addition to its
oncology portfolio of novel biologics as well as biosimilars, which are making a
significant impact in the realm of cancer care in India.
KRABEVA is the second key oncologic biosimilar product from Biocon's global
biosimilar portfolio to be launched in India to address the unmet patient need for
affordable, biological therapies. It is being offered to patients at an MRP of
`24,000 for 100 mg/4 ml vials and `39,990 for 400 mg/16 ml vials
Economic and Political News
Centre announces road projects worth `60,000cr for Tamil Nadu
IPP's thermal power projects in trouble with 60,000-Mw stressed assets
Mining firms to contest Odisha's `2,900cr demand notice
Corporate News
Bharti family pledges `7,000cr to philanthropy
HDFC Bank to develop 1,000 villages under CSR by FY19
BPCL launches two new tenders seeking LNG cargo for delivery
Market Outlook
November 24, 2017
Top Picks HHHHH
Market Cap
CMP
Target
Upside
Company
Rationale
(` Cr)
(`)
(`)
(%)
Strong growth in domestic business due to its leade`hip
in acute therapeutic segment. Alkem expects to launch
Alkem Laboratories
23,542
1,969
2,125
7.9
more products in USA, which bodes for its international
business.
We expect the company would report strong profitability
Asian Granito
1,469
488
570
16.7
owing to better product mix, higher B2C sales and
amalgamation synergy.
Favorable outlook for the AC industry to augur well for
Cooling products business which is out pacing the
Blue Star
6,501
678
867
27.8
market growth. EMPPAC division's profitability to
improve once operating environment turns around.
With a focus on the low and medium income (LMI)
consumer segment, the company has increased its
Dewan Housing Finance
19,401
619
712
15.1
presence in tier-II & III cities where the growth
opportunity is immense.
Loan growth is likely to pick up after a sluggish FY17.
Lower credit cost will help in strong bottom-line growth.
Karur Vysya Bank
7,436
123
180
46.3
Increasing share of CASA will help in NIM
improvement.
High order book execution in EPC segment, rising B2C
KEI Industries
2,636
336
380
12.9
sales and higher exports to boost the revenues and
profitability
Expected to benefit from the lower capex requirement
Music Broadcast
2,140
375
434
15.7
and 15 year long radio broadcast licensing.
Massive capacity expansion along with rail advantage
Navkar Corporation
2,858
190
265
39.6
at ICD as well CFS augur well for the company
Strong brands and distribution network would boost
Siyaram Silk Mills
2,724
581
650
11.8
growth going ahead. Stock currently trades at an
inexpensive valuation.
Market leadership in Hindi news genre and no.
2
viewership ranking in English news genre, exit from the
TV Today Network
2,239
375
435
15.9
radio business, and anticipated growth in ad spends by
corporate to benefit the stock.
After GST, the company is expected to see higher
volumes along with improving product mix. The Gujarat
Maruti Suzuki
2,56,220
8,482
9,489
11.9
plant will also enable higher operating leverage which
will be margin accretive.
We expect loan book to grow at 24.3% over next two
GIC Housing
2,276
423
655
55.0
year; change in borrowing mix will help in NIM
improvement..
We expect sales/PAT to grow at 13.5%/20% over next
LT Foods
1852
69
96
39
two years on the back of strong distribution network &
addition of new products in portfolio.
Source: Company, Angel Research
Market Outlook
November 24, 2017
Key Upcoming Events
Global economic events release calendar
Bloomberg Data
Date
Time Country
Event Description
Unit
Period
Last Reported
Estimated
Nov 27, 2017
8:30 PMUS
New home sales
Thousands
Oct
667.00
623.50
Nov 28, 2017
7:00 PMUS
GDP Qoq (Annualised)
% Change
3Q S
3.00
3.20
Nov 29, 2017
8:30 PMUS
Consumer Confidence
S.A./ 1985=100
Nov
125.90
123.50
3:30 PMEuro Zone
Euro-Zone Consumer Confidence
Value
Nov F
0.10
Nov 30, 2017
7:00 PMUS
Initial Jobless claims
Thousands
Nov 25
239.00
2:25 PMGermany
Unemployment change (000's)
Thousands
Nov
(11.00)
6:30 AMChina
PMI Manufacturing
Value
Nov
51.60
51.50
Dec 01, 2017
3:00 PMUK
PMI Manufacturing
Value
Nov
56.30
Dec 05, 2017
3:30 PMEuro Zone
Euro-Zone GDP s.a. (QoQ)
% Change
3Q F
0.60
Dec 06, 2017
2:30 PMIndia
RBI Reverse Repo rate
%
Dec 6
5.75
5.75
2:30 PMIndia
RBI Repo rate
%
Dec 6
6.00
6.00
2:30 PMIndia
RBI Cash Reserve ratio
%
Dec 6
4.00
4.00
Dec 08, 2017
3:00 PMUK
Industrial Production (YoY)
% Change
Oct
2.50
India
Exports YoY%
% Change
Nov
(1.10)
India
Imports YoY%
% Change
Nov
7.60
China
Exports YoY%
% Change
Nov
6.90
7:00 PMUS
Change in Nonfarm payrolls
Thousands
Nov
261.00
198.00
7:00 PMUS
Unnemployment rate
%
Nov
4.10
4.10
Dec 09, 2017
7:00 AMChina
Consumer Price Index (YoY)
% Change
Nov
1.90
Dec 12, 2017
5:30 PMIndia
Industrial Production YoY
% Change
Oct
3.80
3:00 PMUK
CPI (YoY)
% Change
Nov
3.00
US
Producer Price Index (mom)
% Change
Nov
0.20
Dec 13, 2017
3:00 PMUK
Jobless claims change
% Change
Nov
1.10
7:30 AMChina
Industrial Production (YoY)
% Change
Nov
6.20
Source: Bloomberg, Angel Research
Market Outlook
November 24, 2017
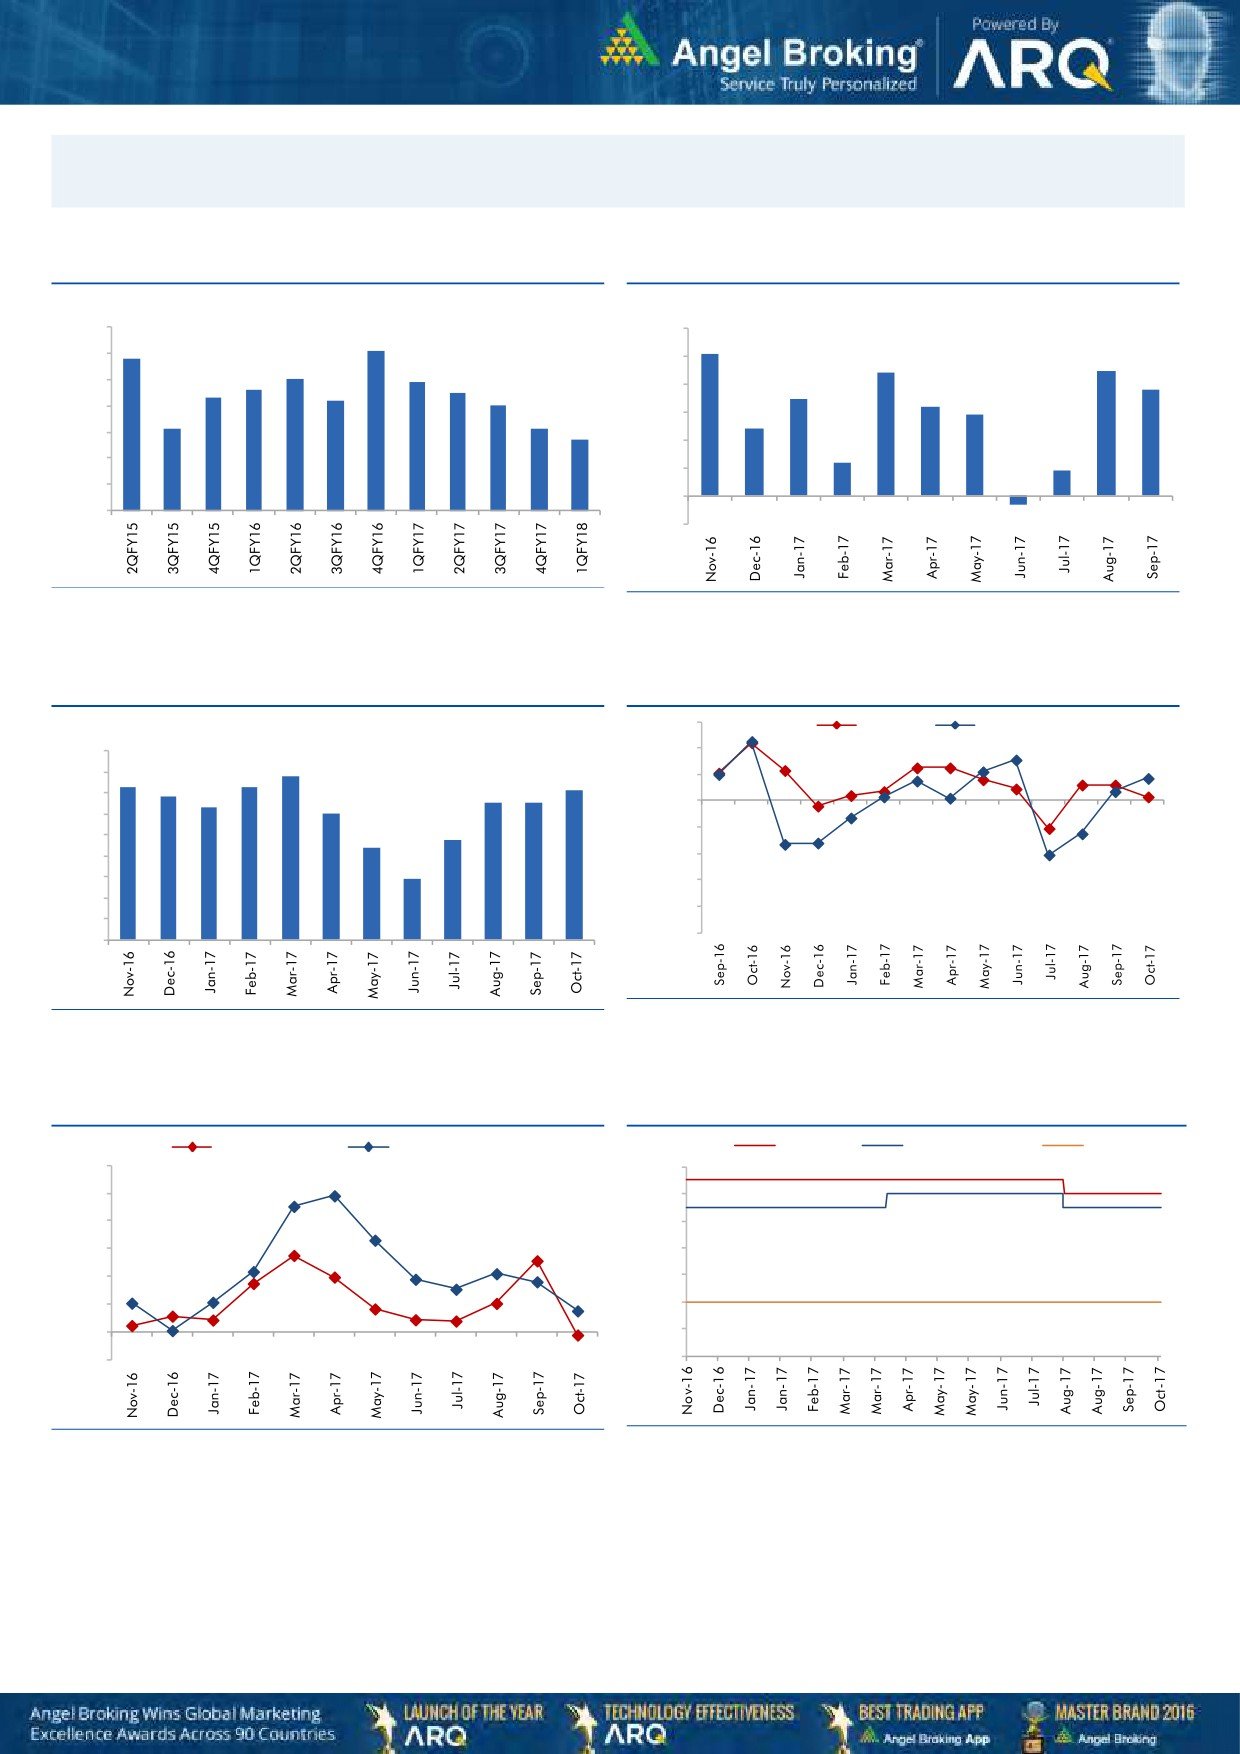
Macro watch
Exhibit 1: Quarterly GDP trends
Exhibit 2: IIP trends
(%)
(%)
10.0
6.0
9.1
5.1
8.8
9.0
5.0
4.4
4.5
8.0
7.9
7.6
7.5
3.8
8.0
7.3
7.2
4.0
3.5
7.0
3.2
2.9
7.0
6.1
6.1
3.0
2.4
5.7
6.0
2.0
1.2
5.0
0.9
1.0
4.0
-
3.0
(1.0)
(0.3)
Source: CSO, Angel Research
Source: MOSPI, Angel Research
Exhibit 3: Monthly CPI inflation trends
Exhibit 4: Manufacturing and services PMI
56.0
Mfg. PMI
Services PMI
(%)
4.5
54.0
3.9
4.0
3.6
3.7
3.6
52.0
3.4
3.2
3.3
3.3
3.5
3.0
50.0
3.0
2.4
48.0
2.5
2.2
2.0
46.0
1.5
1.5
44.0
1.0
42.0
0.5
40.0
-
Source: Market, Angel Research; Note: Level above 50 indicates expansion
Source: MOSPI, Angel Research
Exhibit 5: Exports and imports growth trends
Exhibit 6: Key policy rates
(%)
Exports yoy growth
Imports yoy growth
(%)
Repo rate
Reverse Repo rate
CRR
60.0
6.50
50.0
6.00
40.0
5.50
30.0
5.00
20.0
4.50
10.0
4.00
0.0
3.50
(10.0)
3.00
Source: Bloomberg, Angel Research
Source: RBI, Angel Research
Market Outlook
November 24, 2017
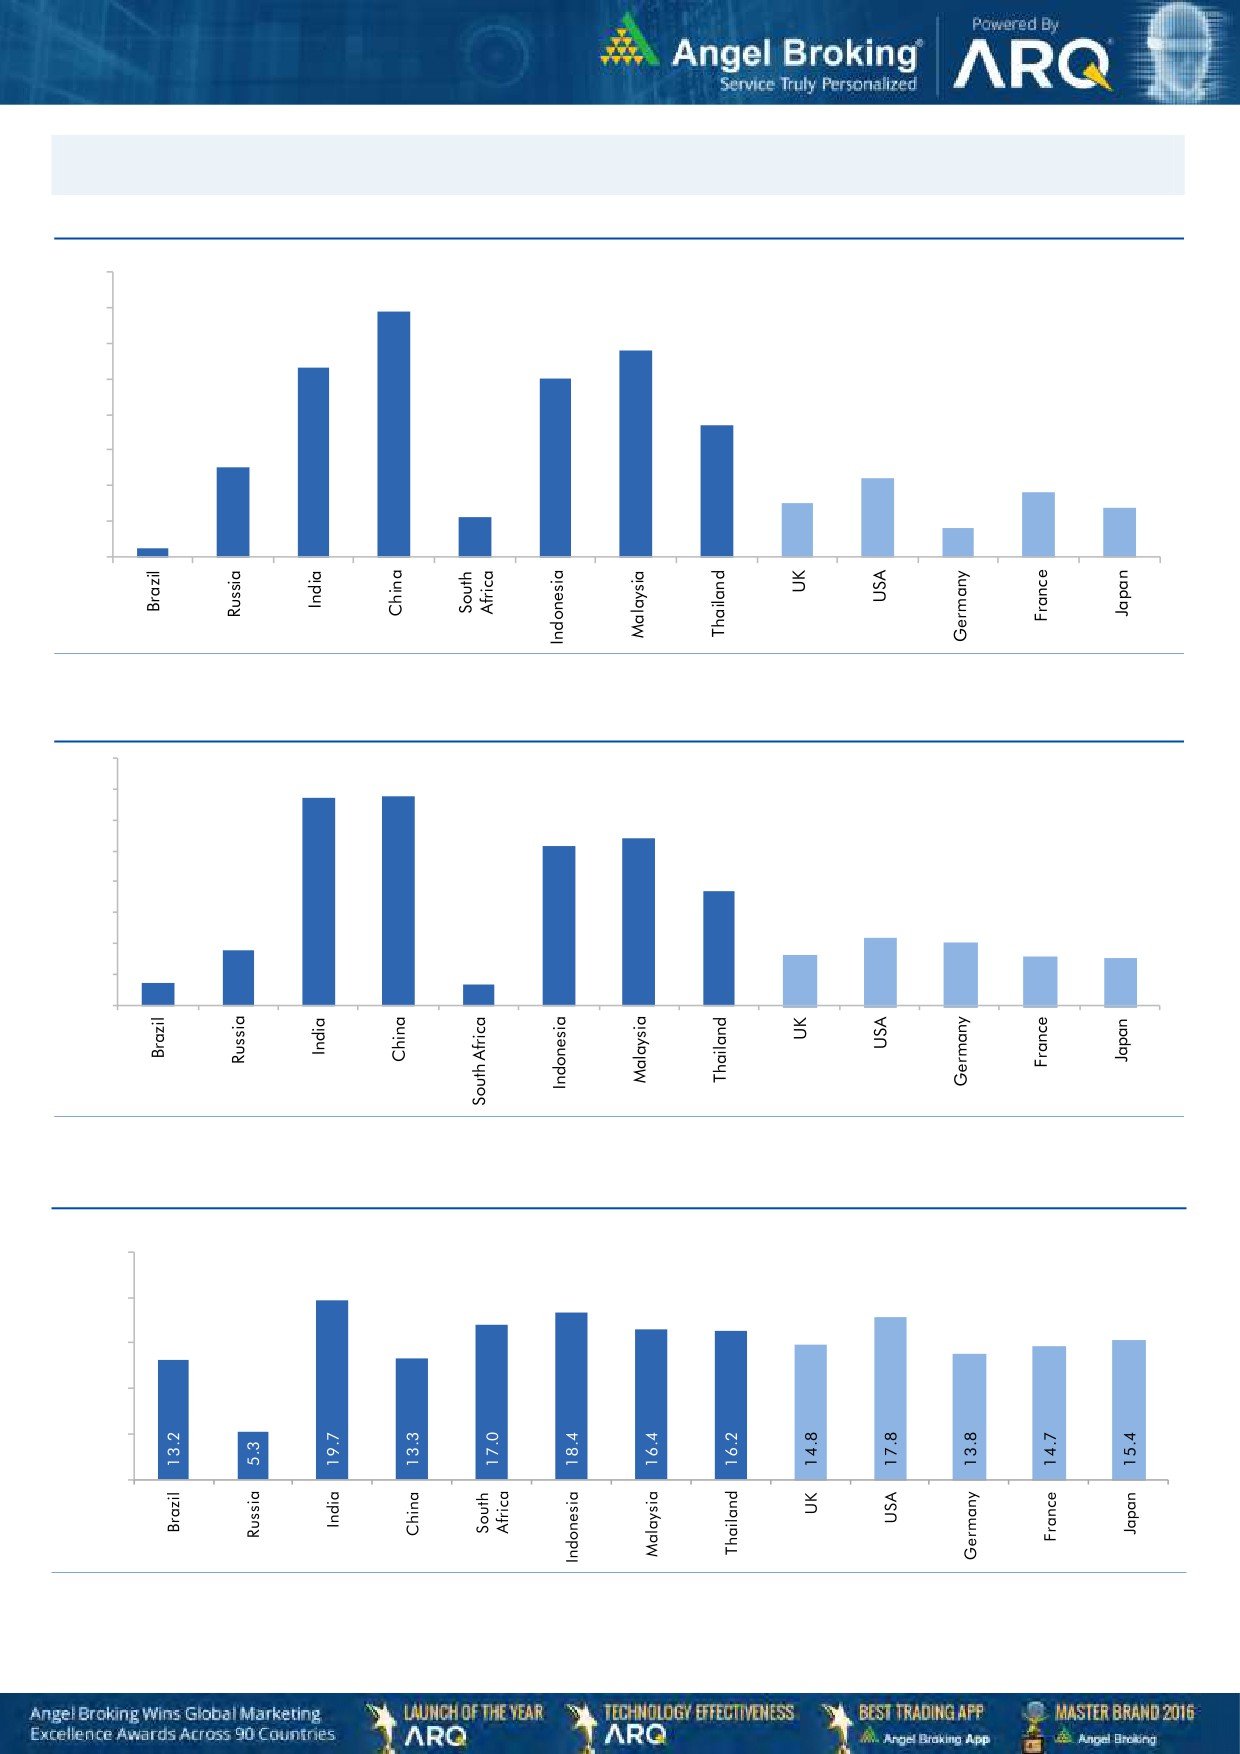
Global watch
Exhibit 1: Latest quarterly GDP Growth (%, yoy) across select developing and developed countries
(%)
8.0
6.9
7.0
5.8
6.0
5.3
5.0
5.0
1.1
3.7
4.0
2.5
3.0
2.2
1.8
2.0
1.5
1.4
0.8
1.0
0.3
-
Source: Bloomberg, Angel Research
Exhibit 2: 2017 GDP Growth projection by IMF (%, yoy) across select developing and developed countries
(%)
6.7
6.8
7.0
6.0
5.4
5.2
5.0
3.7
4.0
3.0
1.8
2.2
2.0
1.7
1.6
2.0
0.7
1.5
0.7
1.0
-
Source: IMF, Angel Research
Exhibit 3: One year forward P-E ratio across select developing and developed countries
(x)
25.0
20.0
15.0
10.0
5.0
-
Source: IMF, Angel Research
Stock Watch
November 24, 2017
Company Name
Reco
CMP
Target
Mkt Cap
Sales ( Čcr )
OPM(%)
EPS (Č)
PER(x)
P/BV(x)
RoE(%)
EV/Sales(x)
(Č)
Price ( Č)
( Č cr )
FY18E FY19E
FY18E
FY19E
FY18E
FY19E
FY18E
FY19E
FY18E
FY19E
FY18E
FY19E
FY18E
FY19E
Agri / Agri Chemical
Rallis
Reduce
234
209
4,553
1,873
2,099
15.0
15.0
9.5
10.5
24.6
22.3
3.7
3.4
15.8
16.0
2.3
2.1
United Phosphorus
Accumulate
749
820
38,096
18,922
21,949
18.0
18.5
36.2
45.6
20.7
16.4
4.3
3.6
22.7
23.8
2.2
1.8
Auto & Auto Ancillary
Ashok Leyland
Accumulate
115
127
33,545
23,339
27,240
10.1
10.8
4.7
6.2
24.7
18.4
4.9
4.3
20.0
23.6
1.4
1.2
Bajaj Auto
Neutral
3,262
-
94,387
23,936
27,955
19.5
20.1
142.7
167.3
22.9
19.5
5.0
4.5
21.8
22.8
3.5
3.0
Bharat Forge
Buy
700
875
32,580
7,637
8,755
21.7
23.2
36.1
47.3
19.4
14.8
3.5
3.0
18.5
20.8
4.1
3.5
Eicher Motors
Neutral
30,620
-
83,355
19,043
22,837
19.5
19.9
835.4
1,019.0
36.7
30.1
13.7
10.6
40.9
37.8
4.2
3.5
Gabriel India
Neutral
189
-
2,721
1,782
2,033
9.7
10.2
7.1
8.9
26.7
21.4
5.4
4.6
21.0
22.2
1.5
1.3
Hero Motocorp
Accumulate
3,679
4,129
73,474
32,239
36,878
16.0
15.6
184.4
206.5
20.0
17.8
6.3
5.5
31.3
30.7
2.1
1.8
Jamna Auto Industries Neutral
64
-
2,542
1,441
1,662
14.4
14.8
13.9
17.6
4.6
3.6
1.3
1.0
30.0
31.0
1.8
1.5
Mahindra and Mahindra Neutral
1,420
-
88,254
46,971
53,816
13.6
14.0
67.7
79.8
21.0
17.8
3.0
2.7
15.0
15.9
1.8
1.5
Maruti
Accumulate
8,482
9,489
256,220
79,470
95,208
15.9
17.2
281.7
363.8
30.1
23.3
6.5
5.3
21.7
22.8
2.9
2.3
Minda Industries
Neutral
1,118
-
9,659
4,328
5,084
11.0
11.9
27.3
36.4
41.0
30.7
8.7
6.8
23.1
25.6
2.3
2.0
Motherson Sumi
Neutral
343
-
72,186
55,937
64,445
10.8
11.4
16.9
21.1
20.3
16.3
4.5
4.6
25.2
25.4
1.3
1.1
Tata Motors
Neutral
426
-
123,030
303,167
343,649
11.8
13.8
33.1
54.7
12.9
7.8
2.1
1.7
16.9
23.0
0.5
0.4
TVS Motor
Neutral
736
-
34,959
13,992
16,216
9.0
9.4
17.1
20.3
43.2
36.3
11.5
8.9
29.7
27.7
2.4
2.1
Amara Raja Batteries
Accumulate
787
858
13,438
6,140
7,122
14.3
15.6
29.3
39.0
26.9
20.2
4.6
3.8
17.1
19.0
2.2
1.9
Exide Industries
Neutral
205
-
17,421
8,689
9,854
15.1
15.2
9.7
11.0
21.2
18.6
3.8
3.3
15.7
16.1
1.7
1.5
Apollo Tyres
Neutral
252
-
14,427
15,739
17,326
13.3
14.6
20.4
26.7
12.4
9.5
1.5
1.3
20.4
26.7
1.1
1.0
Ceat
Neutral
1,811
-
7,326
6,661
7,717
11.1
14.2
116.2
178.2
15.6
10.2
2.7
2.3
15.2
21.3
1.2
1.0
JK Tyres
Neutral
146
-
3,304
8,318
9,239
16.2
16.4
21.0
27.5
7.0
5.3
1.4
1.1
19.1
20.4
0.8
0.7
Swaraj Engines
Neutral
1,900
-
2,360
788
889
16.4
16.5
71.6
81.0
26.5
23.5
7.7
7.1
29.6
31.0
2.7
2.3
Subros
Neutral
268
-
1,610
1,855
2,135
11.6
11.8
10.3
14.7
26.2
18.3
4.0
3.4
15.8
19.1
1.1
0.9
Capital Goods
BEML
Neutral
1,702
-
7,087
4,286
5,194
7.1
8.2
42.9
58.1
39.7
29.3
3.3
3.0
7.6
8.7
1.7
1.4
Bharat Electronics
Neutral
187
-
45,970
10,258
12,470
19.6
19.5
7.3
8.6
25.6
21.8
0.5
0.4
20.4
21.9
4.0
3.2
Voltas
Neutral
624
-
20,659
6,778
8,004
9.6
11.0
17.1
22.4
36.5
27.9
8.7
7.6
17.7
19.8
2.7
2.3
BHEL
Neutral
93
-
34,089
33,200
39,167
6.8
9.5
6.2
11.2
15.0
8.3
0.7
0.7
4.6
8.0
0.6
0.5
Blue Star
Buy
678
867
6,501
5,220
6,207
6.3
6.6
16.8
22.3
40.4
30.4
8.0
7.1
19.9
23.3
1.2
1.0
CG Power and Industrial
Neutral
87
-
5,431
6,555
7,292
7.5
7.5
-
0.8
8,665.0
108.3
1.3
1.4
0.1
1.2
0.9
0.8
Solutions
Greaves Cotton
Neutral
124
-
3,026
1,778
1,993
14.7
15.1
8.1
9.1
15.3
13.6
3.4
3.2
21.8
23.6
1.5
1.3
Stock Watch
November 24, 2017
Company Name
Reco
CMP
Target
Mkt Cap
Sales ( Čcr )
OPM(%)
EPS (Č)
PER(x)
P/BV(x)
RoE(%)
EV/Sales(x)
(Č)
Price ( Č)
( Č cr )
FY18E FY19E
FY18E
FY19E
FY18E
FY19E
FY18E
FY19E
FY18E
FY19E
FY18E
FY19E
FY18E
FY19E
Capital Goods
KEC International
Accumulate
308
350
7,911
9,779
11,113
9.4
9.8
14.2
18.2
21.7
16.9
4.2
3.4
21.1
22.1
1.1
0.9
KEI Industries
Accumulate
336
380
2,636
3,001
3,391
10.0
10.0
13.0
16.1
25.9
20.9
4.7
3.9
18.2
18.7
1.1
0.9
Thermax
Neutral
1,043
-
12,424
4,125
4,747
10.3
10.8
26.7
31.5
39.1
33.1
4.4
4.0
11.2
12.0
2.7
2.4
VATech Wabag
Buy
555
681
3,031
3,867
4,126
9.6
10.0
34.9
39.8
15.9
14.0
2.6
2.3
17.7
17.5
0.8
0.7
Cement
ACC
Neutral
1,712
-
32,156
12,255
13,350
13.5
14.3
58.0
66.2
29.5
25.9
3.5
3.3
11.5
12.2
2.6
2.4
Ambuja Cements
Neutral
265
-
52,600
10,250
11,450
17.5
19.0
7.2
8.3
36.8
31.9
2.6
2.5
7.0
7.8
4.9
4.3
India Cements
Neutral
176
-
5,411
6,135
6,750
14.8
15.2
8.5
11.5
20.7
15.3
1.0
1.0
4.8
6.2
1.2
1.1
JK Cement
Neutral
998
-
6,980
4,150
4,775
19.2
20.0
49.0
63.5
20.4
15.7
3.2
2.8
17.0
18.5
2.1
1.8
J K Lakshmi Cement
Neutral
396
-
4,654
3,422
3,757
15.5
17.0
13.5
23.2
29.3
17.1
3.0
2.6
10.8
15.5
1.8
1.5
Orient Cement
Neutral
163
-
3,341
2,215
3,233
16.8
17.0
5.9
6.9
27.6
23.6
2.1
2.0
10.8
10.1
2.5
1.7
UltraTech Cement
Neutral
4,192
-
115,092
28,250
35,150
20.2
23.5
77.5
122.2
54.1
34.3
4.6
4.1
9.6
14.8
4.5
3.6
Construction
KNR Constructions
Neutral
276
-
3,878
1,846
2,203
14.5
14.5
12.1
13.7
22.8
20.2
1.3
1.1
17.5
16.7
2.2
1.8
Larsen & Toubro
Neutral
1,216
-
170,408
95,787
109,476
10.2
11.6
44.5
50.8
27.4
24.0
3.4
3.1
12.9
13.1
2.3
2.1
Gujarat Pipavav Port
Neutral
149
-
7,179
739
842
61.6
62.7
5.1
6.2
29.1
24.2
3.6
3.5
12.7
14.9
9.2
7.9
PNC Infratech
Neutral
183
-
4,697
2,040
2,935
13.0
13.0
6.4
9.0
28.6
20.3
0.7
0.7
9.7
12.2
2.3
1.7
Simplex Infra
Neutral
548
-
2,711
6,012
6,619
11.6
11.7
21.1
31.0
26.0
17.7
1.8
1.7
6.5
8.6
1.0
0.9
Sadbhav Engineering
Neutral
360
-
6,177
3,823
4,426
10.7
10.8
10.3
11.8
35.0
30.5
4.2
3.7
10.1
10.5
1.9
1.7
NBCC
Neutral
266
-
23,945
9,099
12,706
6.4
6.4
7.3
9.6
36.6
27.8
1.6
1.3
27.5
30.5
2.5
1.8
MEP Infra
Neutral
99
-
1,608
2,403
2,910
18.3
16.8
2.4
6.1
42.1
16.3
16.0
10.8
35.2
55.8
1.8
1.5
SIPL
Neutral
136
-
4,774
2,060
2,390
46.8
47.7
(5.8)
(3.1)
5.1
5.8
(14.2)
(2.3)
7.1
6.6
Engineers India
Neutral
184
-
12,372
1,795
2,611
21.1
22.4
5.9
8.1
31.1
22.7
2.2
2.2
12.9
16.1
5.3
3.5
Financials
Axis Bank
Accumulate
544
580
130,517
32,558
35,843
3.5
3.2
27.8
41.0
19.6
13.3
2.1
1.9
11.4
14.9
-
-
Bank of Baroda
Neutral
178
-
41,014
22,533
26,079
2.4
2.4
12.0
20.9
14.8
8.5
1.0
0.9
6.6
11.0
-
-
Canara Bank
Neutral
394
-
23,521
17,925
20,235
2.0
2.1
18.5
36.5
21.3
10.8
0.8
0.8
3.4
6.2
-
-
Can Fin Homes
Neutral
461
-
6,133
586
741
3.5
3.5
107.8
141.0
4.3
3.3
0.9
0.8
24.1
25.6
-
-
Cholamandalam Inv. &
Neutral
1,274
-
19,915
2,826
3,307
6.3
6.3
53.7
64.6
23.8
19.7
4.0
3.5
18.3
18.9
-
-
Fin. Co.
Dewan Housing Finance Buy
619
712
19,401
2,676
3,383
2.4
2.7
37.4
49.7
16.5
12.5
2.2
1.9
13.8
16.2
-
-
Equitas Holdings
Buy
145
235
4,919
1,125
1,380
9.6
9.8
1.5
6.0
96.6
24.2
2.2
2.0
2.4
8.2
-
-
Federal Bank
Accumulate
113
125
22,182
4,896
5,930
2.8
3.1
5.4
7.6
21.1
14.9
1.8
1.6
8.5
11.0
-
-
Stock Watch
November 24, 2017
Company Name
Reco
CMP
Target
Mkt Cap
Sales ( Čcr )
OPM(%)
EPS (Č)
PER(x)
P/BV(x)
RoE(%)
EV/Sales(x)
(Č)
Price ( Č)
( Č cr )
FY18E FY19E
FY18E
FY19E
FY18E
FY19E
FY18E
FY19E
FY18E
FY19E
FY18E
FY19E
FY18E
FY19E
Financials
GIC Housing
Buy
423
655
2,276
376
477
3.6
3.7
33.0
40.0
12.8
10.6
2.3
1.9
20.0
23.0
-
-
HDFC Bank
Neutral
1,847
-
477,566
55,236
63,253
4.5
4.4
68.9
82.4
26.8
22.4
4.7
3.9
18.7
18.5
-
-
ICICI Bank
Neutral
319
-
204,834
42,361
51,378
3.6
3.9
18.4
25.7
17.4
12.4
1.9
1.8
11.3
15.0
-
-
Karur Vysya Bank
Buy
123
180
7,436
3,289
3,630
3.7
3.9
10.8
14.1
11.4
8.7
1.4
1.2
12.5
14.7
-
-
LIC Housing Finance
Neutral
602
-
30,403
4,895
6,332
3.4
3.7
50.7
66.8
11.9
9.0
2.4
2.0
21.7
23.8
-
-
Punjab Natl.Bank
Neutral
187
-
39,687
23,708
25,758
2.1
2.1
5.9
16.4
31.7
11.4
0.9
0.9
3.0
8.3
-
-
RBL Bank
Neutral
508
-
21,148
2,309
2,888
2.6
2.5
16.4
19.1
31.0
26.6
3.9
3.5
13.3
13.8
-
-
Repco Home Finance
Buy
621
825
3,884
496
597
4.4
4.2
38.5
48.7
16.1
12.7
2.9
2.4
19.6
20.6
-
-
South Ind.Bank
Neutral
31
-
5,634
3,195
3,567
3.0
3.1
3.0
3.8
10.3
8.1
1.0
0.9
10.5
11.9
-
-
St Bk of India
Neutral
335
-
289,087
105,827
121,056
2.4
2.5
16.1
25.6
20.8
13.1
1.6
1.5
6.6
9.9
-
-
Union Bank
Neutral
167
-
12,102
14,650
16,225
2.3
2.3
23.1
32.5
7.2
5.1
0.6
0.5
7.1
9.2
-
-
Yes Bank
Neutral
312
-
71,656
11,088
13,138
3.0
2.9
84.0
99.3
3.7
3.1
0.6
0.5
16.3
16.8
-
-
FMCG
Akzo Nobel India
Neutral
1,820
-
8,729
3,164
3,607
13.8
13.7
58.6
67.9
31.1
26.8
7.6
6.7
24.5
25.1
2.6
2.3
Asian Paints
Neutral
1,161
-
111,387
17,603
20,615
18.6
18.6
2,128.9
2,543.3
0.6
0.5
11.5
9.7
28.0
28.9
6.1
5.2
Britannia
Neutral
4,774
-
57,310
9,690
11,278
14.8
15.4
84.0
101.0
56.8
47.3
20.7
16.5
40.6
39.0
5.9
5.0
Colgate
Neutral
1,048
-
28,490
4,420
5,074
24.9
25.3
28.6
32.8
36.6
31.9
14.5
11.7
43.8
40.5
6.2
5.4
Dabur India
Neutral
340
-
59,874
8,346
9,344
19.6
19.9
7.8
9.0
43.6
37.8
8.8
7.9
25.2
24.8
6.8
6.0
GlaxoSmith Con*
Neutral
6,053
-
25,458
5,072
5,760
18.2
18.4
176.3
199.2
34.3
30.4
7.3
6.6
21.2
21.7
4.3
3.8
Godrej Consumer
Neutral
954
-
65,016
10,171
11,682
20.8
21.5
21.7
27.1
44.0
35.2
9.9
8.5
22.3
23.4
6.5
5.6
HUL
Neutral
1,269
-
274,705
37,077
41,508
20.3
21.8
5,189.9
6,318.5
0.2
0.2
38.7
33.1
74.8
82.0
7.3
6.5
ITC
Neutral
258
-
314,569
44,588
49,853
37.0
37.3
9.6
11.0
26.9
23.5
6.6
6.3
25.1
27.3
6.5
5.8
Marico
Neutral
304
-
39,298
6,788
7,766
18.5
19.2
7.1
8.5
42.9
35.8
15.0
12.9
36.9
38.0
5.6
4.9
Nestle*
Neutral
7,625
-
73,514
10,083
11,182
20.0
20.9
119.7
141.3
63.7
54.0
224.5
205.2
36.7
39.8
7.0
6.2
Tata Global
Neutral
275
-
17,325
7,121
7,641
11.9
12.3
6.9
8.0
39.8
34.3
2.7
2.5
6.8
7.2
2.2
2.1
Procter & Gamble
Neutral
9,200
-
29,864
3,034
3,579
27.1
27.7
167.7
198.8
54.9
46.3
14.7
12.7
28.8
29.5
9.3
7.8
Hygiene
IT
HCL Tech^
Buy
853
1,014
121,765
50,009
54,608
22.1
22.1
62.8
67.6
13.6
12.6
3.1
2.6
22.4
20.6
2.1
1.8
Infosys
Accumulate
991
1,120
227,724
70,333
75,960
26.0
26.0
61.7
65.9
16.1
15.0
3.0
2.8
18.9
18.7
2.6
2.4
TCS
Reduce
2,683
2,442
513,556
123,384
134,488
26.1
26.1
133.2
143.7
20.1
18.7
5.6
5.2
27.6
27.8
3.8
3.5
Tech Mahindra
Accumulate
489
526
47,774
30,545
32,988
15.0
15.0
35.2
37.6
13.9
13.0
2.3
2.2
16.8
16.2
1.3
1.2
Stock Watch
November 24, 2017
Company Name
Reco
CMP
Target
Mkt Cap
Sales ( Čcr )
OPM(%)
EPS (Č)
PER(x)
P/BV(x)
RoE(%)
EV/Sales(x)
(Č)
Price ( Č)
( Č cr )
FY18E FY19E
FY18E
FY19E
FY18E
FY19E
FY18E
FY19E
FY18E
FY19E
FY18E
FY19E
FY18E
FY19E
IT
Wipro
Neutral
293
-
142,789
54,164
56,544
22.3
22.3
18.8
19.5
15.6
15.1
2.5
2.2
15.0
13.6
1.9
1.6
Media
D B Corp
Neutral
364
-
6,693
2,404
2,625
30.5
31.5
23.7
26.9
15.4
13.5
3.6
3.1
23.5
22.8
2.6
2.4
HT Media
Neutral
102
-
2,369
2,589
2,830
15.1
15.4
8.3
10.9
12.3
9.3
1.0
0.9
8.4
10.4
0.5
0.3
Jagran Prakashan
Buy
165
225
5,146
2,541
2,835
28.5
28.7
12.7
14.1
13.0
11.7
2.7
2.3
21.3
21.4
1.9
1.6
Sun TV Network
Neutral
879
-
34,622
3,238
3,789
51.9
55.1
30.9
38.0
28.4
23.1
8.1
7.1
30.0
31.0
10.2
8.6
Hindustan Media
Neutral
246
-
1,802
1,002
1,074
23.3
23.5
29.2
33.8
8.4
7.3
1.3
1.1
15.6
15.4
0.8
0.5
Ventures
TV Today Network
Buy
375
435
2,239
667
727
27.7
27.7
18.6
20.1
20.2
18.7
3.1
3.2
15.6
17.3
2.9
2.7
Music Broadcast Limited Buy
375
434
2,140
271
317
91.0
109.0
6.0
10.0
62.5
37.5
3.9
3.5
6.5
9.3
7.5
6.2
Metals & Mining
Coal India
Neutral
271
-
168,159
82,301
91,235
17.0
18.0
17.1
20.5
15.8
13.2
3.0
2.8
45.0
55.0
1.7
1.5
Hind. Zinc
Neutral
313
-
132,316
22,108
24,555
57.0
58.0
22.1
26.3
14.2
11.9
4.6
3.7
32.0
35.0
5.0
4.2
Hindalco
Neutral
255
-
57,287
102,350
105,355
13.5
14.5
21.5
24.5
11.9
10.4
1.6
1.4
15.0
15.2
1.1
1.1
JSW Steel
Neutral
267
-
64,552
64,500
68,245
21.1
21.5
20.1
21.2
13.3
12.6
2.4
2.1
-
-
1.7
1.7
NMDC
Neutral
127
-
40,166
10,209
11,450
47.0
48.0
11.1
12.1
11.4
10.5
1.6
1.5
-
-
3.4
3.1
SAIL
Neutral
82
-
33,970
54,100
63,555
3.0
10.0
(10.0)
1.5
54.8
1.1
1.1
-
-
1.6
1.4
Vedanta
Neutral
309
-
114,787
81,206
87,345
28.0
29.0
26.5
33.5
11.7
9.2
2.7
2.3
-
-
2.2
1.9
Tata Steel
Neutral
711
-
69,078
121,445
126,500
16.2
17.2
65.4
81.3
10.9
8.8
1.7
1.5
-
-
1.1
1.0
Oil & Gas
GAIL
Neutral
462
-
78,180
53,115
52,344
14.2
15.3
30.0
31.1
15.4
14.9
1.9
1.8
-
-
1.2
1.2
ONGC
Neutral
181
-
232,859
83,111
84,934
44.2
44.9
16.4
16.9
11.1
10.7
1.3
1.2
-
-
2.7
2.6
Indian Oil Corp
Neutral
394
-
191,371
396,116
432,560
8.5
8.8
40.1
42.2
9.8
9.3
1.7
1.5
-
-
0.6
0.6
Reliance Industries
Neutral
945
-
614,707
257,711
267,438
17.0
18.2
89.1
89.5
10.6
10.6
1.0
0.9
-
-
2.0
2.0
Pharmaceuticals
Alembic Pharma
Buy
514
600
9,696
3,346
3,915
19.6
19.2
21.0
23.9
24.5
21.5
4.3
3.7
19.1
18.4
2.9
2.5
Alkem Laboratories Ltd
Accumulate
1,969
2,125
23,542
6,320
7,341
17.5
19.8
72.7
96.6
27.1
20.4
4.8
4.0
16.7
18.7
3.7
3.1
Aurobindo Pharma
Buy
696
823
40,766
17,086
19,478
22.1
22.0
44.7
51.4
15.6
13.5
3.5
2.8
24.7
22.7
2.5
2.2
Aventis*
Neutral
4,449
-
10,247
2,411
2,698
18.8
18.8
151.6
163.9
29.4
27.2
4.6
3.7
25.4
27.5
3.8
3.2
Cadila Healthcare
Reduce
444
411
45,403
11,365
12,926
20.0
20.0
18.4
20.5
24.1
21.6
5.3
4.4
24.3
22.2
4.1
3.5
Cipla
Sell
617
462
49,682
16,163
18,711
16.6
16.9
20.7
24.3
29.8
25.4
3.5
3.1
12.6
13.1
3.2
2.7
Dr Reddy's
Reduce
2,312
2,040
38,332
13,734
15,548
17.7
20.2
69.9
102.0
33.1
22.7
2.9
2.7
9.2
12.4
3.0
2.6
GSK Pharma*
Sell
2,505
2,000
21,216
2,968
3,324
13.8
15.9
37.8
46.3
66.3
54.1
11.6
12.7
16.7
22.4
7.0
6.4
Indoco Remedies
Sell
295
153
2,722
1,154
1,310
14.9
14.9
11.3
12.7
26.1
23.3
3.7
3.3
15.0
15.0
2.5
2.1
Stock Watch
November 24, 2017
Company Name
Reco
CMP
Target
Mkt Cap
Sales ( Čcr )
OPM(%)
EPS (Č)
PER(x)
P/BV(x)
RoE(%)
EV/Sales(x)
(Č)
Price ( Č)
( Č cr )
FY18E FY19E
FY18E
FY19E
FY18E
FY19E
FY18E
FY19E
FY18E
FY19E
FY18E
FY19E
FY18E
FY19E
Pharmaceuticals
Ipca labs
Neutral
539
-
6,795
3,593
4,022
14.5
15.5
19.4
25.2
27.8
21.4
2.5
2.3
9.5
11.2
2.0
1.7
Lupin
Buy
828
1,091
37,400
16,240
18,562
21.3
21.7
42.5
49.6
19.5
16.7
2.4
2.2
13.3
13.7
2.4
2.0
Natco Pharma
Buy
909
1,057
15,852
1,886
2,016
32.3
29.5
23.2
22.0
39.3
41.2
8.2
7.3
20.9
17.6
8.3
7.7
Sun Pharma
Neutral
545
-
130,699
32,899
36,451
26.9
25.4
21.3
24.8
25.6
22.0
3.0
2.6
18.7
18.8
3.6
3.1
Syngene International
Accumulate
519
556
10,372
1,394
1,818
33.0
36.0
15.8
20.6
32.8
25.2
6.1
5.0
18.6
20.0
7.4
5.7
Power
Tata Power
Neutral
93
-
25,195
32,547
33,806
20.5
20.5
4.7
5.4
19.8
17.4
1.9
1.6
10.5
10.5
1.8
1.7
NTPC
Neutral
180
-
148,418
86,070
101,246
28.3
30.7
12.9
16.2
14.0
11.1
1.4
1.3
10.6
12.4
3.1
2.8
Power Grid
Accumulate
209
223
109,445
29,183
32,946
89.7
90.0
18.0
20.8
11.7
10.1
1.9
1.7
17.7
18.2
7.7
7.1
Real Estate
Prestige Estate
Neutral
313
-
11,736
4,607
5,146
21.0
22.2
7.9
9.8
39.6
31.9
2.4
2.3
10.3
12.0
3.7
3.4
MLIFE
Buy
448
522
2,297
487
590
12.3
17.8
21.0
31.2
21.3
14.4
1.1
1.1
5.2
7.4
3.4
2.8
Telecom
Bharti Airtel
Neutral
496
-
198,291
97,903
105,233
36.0
36.3
9.3
11.1
53.3
44.9
2.6
2.4
5.0
5.6
3.0
2.7
Idea Cellular
Neutral
96
-
34,648
35,012
37,689
27.1
27.7
(4.4)
(2.7)
1.5
1.6
(6.8)
(4.6)
2.3
2.1
zOthers
Abbott India
Neutral
4,861
-
10,330
3,244
3,723
14.9
16.1
167.5
209.4
29.0
23.2
6.4
5.4
23.7
24.8
2.8
2.4
Asian Granito
Buy
488
570
1,469
1,169
1,286
12.5
12.5
16.0
19.7
30.6
24.8
3.3
2.9
10.7
11.6
1.5
1.3
Bajaj Electricals
Neutral
464
-
4,716
4,646
5,301
6.7
7.6
16.1
22.3
28.8
20.8
4.7
4.0
16.4
19.2
1.0
0.9
Banco Products (India)
Neutral
238
-
1,702
1,530
1,695
13.2
12.7
19.0
20.0
12.5
11.9
2.0
1.8
0.2
0.2
1.0
114.0
Coffee Day Enterprises
Neutral
235
-
4,832
3,494
3,913
17.4
18.0
4.8
5.7
-
41.2
2.1
2.0
-
0.1
1.8
1.6
Ltd
Elecon Engineering
Neutral
76
-
847
171
201
15.0
16.2
36.0
43.0
2.1
1.8
0.2
0.2
0.1
0.1
4.3
3.7
Garware Wall Ropes
Neutral
935
-
2,045
928
1,003
15.2
15.2
39.4
43.2
23.7
21.7
3.9
3.3
16.5
15.4
2.1
1.8
Goodyear India*
Neutral
862
-
1,988
1,717
1,866
11.8
12.3
47.9
49.8
18.0
17.3
2.8
2.4
15.6
15.7
0.9
122.2
Hitachi
Neutral
2,505
-
6,812
2,355
2,715
10.3
10.8
49.0
60.9
51.1
41.1
12.0
9.5
0.2
0.2
2.9
2.5
HSIL
Neutral
496
-
3,587
2,240
2,670
14.6
15.0
17.0
22.0
29.2
22.6
2.4
2.3
0.1
0.1
1.8
1.5
Interglobe Aviation
Neutral
1,169
-
44,928
22,570
27,955
14.2
15.0
63.6
81.8
18.4
14.3
9.7
8.2
0.5
0.6
1.7
1.3
Jyothy Laboratories
Neutral
376
-
6,839
1,781
2,044
14.1
15.0
9.4
10.5
40.2
35.8
8.6
8.0
0.2
0.2
4.1
3.5
Linc Pen & Plastics
Neutral
281
-
415
420
462
9.3
9.3
15.3
17.1
18.4
16.4
3.1
3.2
16.9
19.5
1.0
1.0
M M Forgings
Neutral
893
-
1,078
542
642
20.1
21.0
41.6
56.8
21.5
15.7
3.0
2.5
0.1
0.2
2.4
2.1
Mirza International
Neutral
163
-
1,962
1,148
1,285
18.0
18.0
8.0
9.4
20.3
17.4
3.4
2.8
16.3
16.1
1.9
1.6
Navkar Corporation
Buy
190
265
2,858
561
617
41.5
41.5
11.5
12.7
16.5
14.9
1.7
1.6
10.5
10.4
5.8
5.0
Nilkamal
Neutral
1,706
-
2,546
2,317
2,525
11.4
11.1
96.0
105.0
17.8
16.3
3.0
2.6
0.2
0.2
1.1
1.0
Stock Watch
November 24, 2017
Company Name
Reco
CMP
Target Mkt Cap
Sales ( Čcr )
OPM(%)
EPS (Č)
PER(x)
P/BV(x)
RoE(%)
EV/Sales(x)
(Č)
Price ( Č)
( Č cr )
FY18E FY19E FY18E FY19E FY18E FY19E FY18E FY19E FY18E FY19E FY18E FY19E FY18E FY19E
zOthers
Parag Milk Foods
Neutral
241
-
2,027
1,987
2,379
7.6
9.0
12.4
18.3
19.4
13.2
2.7
2.4
8.2
13.2
1.1
1.0
Radico Khaitan
Neutral
282
-
3,749
1,811
1,992
13.2
13.2
8.1
8.8
34.8
32.0
3.5
3.8
10.1
12.0
2.4
2.2
Relaxo Footwears
Neutral
617
-
7,424
1,981
2,310
13.7
14.5
12.0
15.5
51.4
39.8
10.0
8.1
0.2
0.2
3.8
3.3
Siyaram Silk Mills
Accumulate
581
650
2,724
1,769
1,981
12.7
12.7
22.6
26.2
25.7
22.2
4.0
3.4
15.5
15.5
1.7
1.5
Styrolution ABS India* Neutral
912
-
1,603
1,800
1,980
8.0
8.1
42.0
46.2
21.7
19.7
2.4
2.2
0.1
0.1
1.0
0.9
Surya Roshni
Neutral
393
-
1,724
4,870
5,320
7.7
7.8
22.8
28.1
17.3
14.0
2.3
2.0
0.1
0.1
0.6
0.5
TVS Srichakra
Neutral
3,316
-
2,539
2,729
2,893
12.7
12.5
248.5
265.0
13.3
12.5
3.8
3.1
0.3
0.3
0.9
0.9
Visaka Industries
Neutral
625
-
993
1,104
1,214
12.1
12.6
31.0
37.9
20.2
16.5
2.5
2.2
0.1
0.1
1.1
1.0
VIP Industries
Neutral
345
-
4,876
1,450
1,693
10.4
10.5
6.5
7.8
52.7
44.2
11.2
9.7
21.1
22.1
3.4
2.9
Navin Fluorine
Neutral
708
-
3,493
945
1,154
22.4
22.6
28.7
34.8
24.7
20.4
4.1
3.5
-
-
3.2
2.5
Source: Company, Angel Research; Note: *December year end; #September year end; &October year end; Price as on November 23, 2017
Market Outlook
November 24, 2017
Research Team Tel: 022 - 39357800
DISCLAIMER
Angel Broking Private Limited (hereinafter referred to as “Angel”) is a registered Member of National Stock Exchange of India
Limited,Bombay Stock Exchange Limited and Metropolitan Stock Exchange Limited. It is also registered as a Depository Participant with
CDSL and Portfolio Manager with SEBI. It also has registration with AMFI as a Mutual Fund Distributor. Angel Broking Private Limited is a
registered entity with SEBI for Research Analyst in terms of SEBI (Research Analyst) Regulations, 2014 vide registration number
INH000000164. Angel or its associates has not been debarred/ suspended by SEBI or any other regulatory authority for accessing
/dealing in securities Market. Angel or its associates/analyst has not received any compensation / managed or
co-managed public offering of securities of the company covered by Analyst during the past twelve months.
This document is solely for the personal information of the recipient, and must not be singularly used as the basis of any investment
decision. Nothing in this document should be construed as investment or financial advice. Each recipient of this document should make
such investigations as they deem necessary to arrive at an independent evaluation of an investment in the securities of the companies
referred to in this document (including the merits and risks involved), and should consult their own advisors to determine the merits and
risks of such an investment.
Reports based on technical and derivative analysis center on studying charts of a stock's price movement, outstanding positions and
trading volume, as opposed to focusing on a company's fundamentals and, as such, may not match with a report on a company's
fundamentals. Investors are advised to refer the Fundamental and Technical Research Reports available on our website to evaluate the
contrary view, if any.
The information in this document has been printed on the basis of publicly available information, internal data and other reliable
sources believed to be true, but we do not represent that it is accurate or complete and it should not be relied on as such, as this
document is for general guidance only. Angel Broking Pvt. Limited or any of its affiliates/ group companies shall not be in any way
responsible for any loss or damage that may arise to any person from any inadvertent error in the information contained in this report.
Angel Broking Pvt. Limited has not independently verified all the information contained within this document. Accordingly, we cannot
testify, nor make any representation or warranty, express or implied, to the accuracy, contents or data contained within this document.
While Angel Broking Pvt. Limited endeavors to update on a reasonable basis the information discussed in this material, there may be
regulatory, compliance, or other reasons that prevent us from doing so.
This document is being supplied to you solely for your information, and its contents, information or data may not be reproduced,
redistributed or passed on, directly or indirectly.
Neither Angel Broking Pvt. Limited, nor its directors, employees or affiliates shall be liable for any loss or damage that may arise from
or in connection with the use of this information.